Soil Temperature Map
This interactive soil temperature map, also called a ground temperature map, shows live readings across the United States from USDA SCAN (Soil Climate Analysis Network) and NOAA USCRN (US Climate Reference Network) stations. Search by ZIP code or use your location to find the nearest measured station and current soil temperature by depth, and click any station for detailed readings.
Today’s National Soil Temperature Map
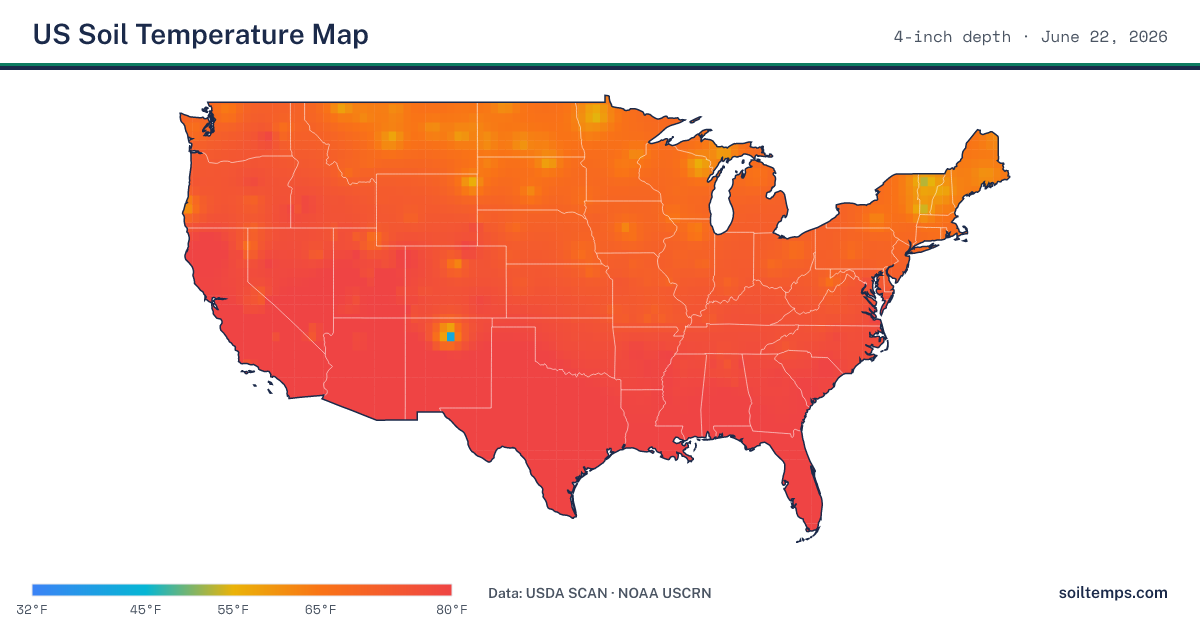
Interpolated from the latest 4-inch readings at each station and refreshed daily. Use the interactive map above for station-level detail and other depths.
Understanding the Map
The heatmap overlay interpolates soil temperatures between stations to show regional patterns. The Action Status view groups the 2-inch soil temperature, the depth where weed seeds germinate, into three bands. What each band means depends on the season, and the map legend updates to match:
- Below 50°F: too cold for germination and for most lawn applications
- 50–55°F: the spring pre-emergent application band; in fall, the window is closing
- Above 55°F: in spring the window is open, apply within 7–10 days; in summer it has passed; in fall, watch for the 65–70°F falling poa annua window
Soil Temperature by Depth: 2, 4, and 8 Inch Readings
The map’s depth selector switches between the three depths federal stations report most consistently. Each answers a different timing question:
| Depth | What it times | Why this depth |
|---|---|---|
| 2 in | Weed-seed germination, pre-emergent timing (50–55°F spring band), grass seeding, shallow-rooted crops | Where weed and grass seeds actually sit |
| 4 in | Fertilizer, aeration, and disease timing for established lawns | The root-zone reading most product labels reference; changes more slowly than the surface |
| 8 in | Deep planting and warm-season grass establishment | Deep root-zone trend; the steadiest of the three |
Popular Locations
Time Your Next Lawn Task
- When to Apply Broadleaf Weed Killer on Cool-Season Lawns in Spring
- How to Identify and Kill Nutsedge in Your Lawn
- How to Apply Liquid Pre-Emergent Herbicide
Browse All Monitoring Stations
See every USDA SCAN, CSCAN, and NOAA USCRN station with current readings and historical data on the stations index.
About the Data
Soil temperature readings come from the USDA SCAN network of approximately 200 automated stations across the continental United States. Data is updated daily. The heatmap between stations is generated using inverse distance weighted (IDW) interpolation, so readings are most accurate near station locations.
Every station value on this map is measured by an in-ground sensor, not estimated from a weather model. The methodology page covers the sensor networks, depths, and update cadence.