
Soil Moisture in Arizona
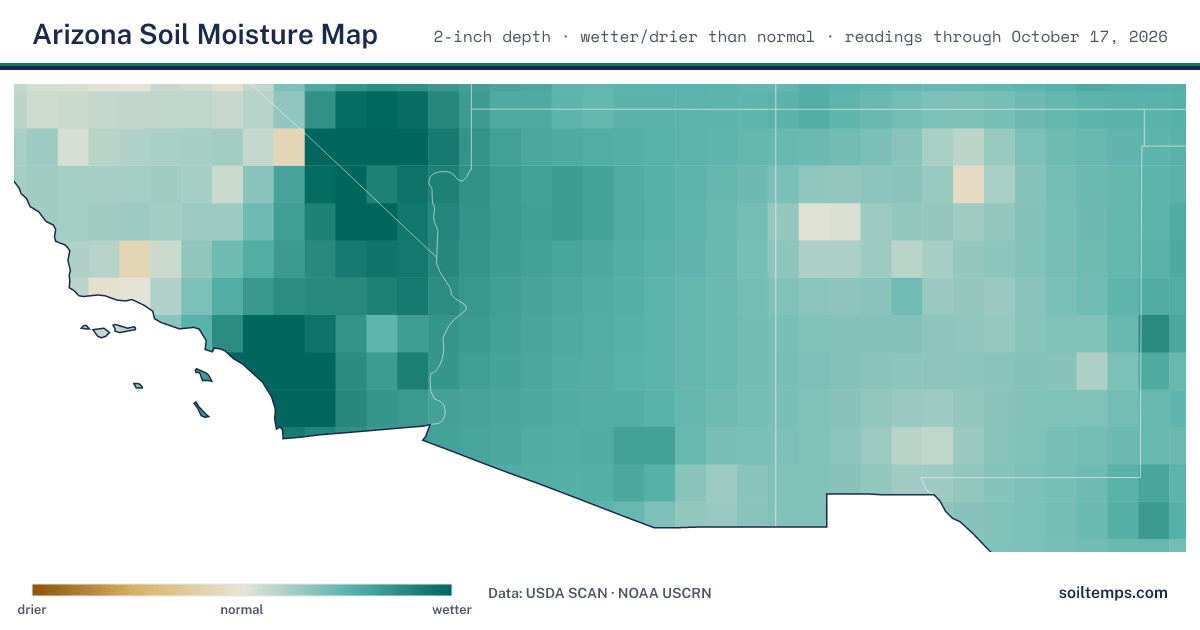
Soil moisture across Arizona, interpolated from the latest readings at each station and refreshed daily. Brown is drier than normal, teal is wetter than normal.
Across 5 monitoring stations in Arizona, 4 are wetter than normal, and 1 is about normal. Last updated October 17, 2026. Each station is compared against its own moisture history for this date, not against other stations, so wetter or drier than normal means the same thing at every station.
How This Is Measured
Every reading here is measured by an in-ground sensor at USDA SCAN (Soil Climate Analysis Network) and NOAA USCRN (US Climate Reference Network) stations, at or near the 2-inch root-zone depth, not modeled. A raw moisture percentage is not comparable between two soils, so each station is compared against its own history for the date. That comparison, wetter or drier than this station normally is, is the honest signal. These stations belong to the 326 active USDA and NOAA in-ground monitoring stations Soil Temps reads; only those with a moisture sensor and at least two years of their own history are compared here.
Stations Measuring Soil Moisture in Arizona (5)
| Station | Depth | Moisture | vs. Normal | Last Reading |
|---|---|---|---|---|
| Elgin 5 S NOAA USCRN | 2" | 6% | Wetter than normal | Oct 16, 2026 |
| Tucson 11 W NOAA USCRN | 2" | 7% | Wetter than normal | Oct 16, 2026 |
| Williams 35 NNW NOAA USCRN | 2" | 16% | Much wetter than normal | Oct 16, 2026 |
| Yuma 27 ENE NOAA USCRN | 2" | 7% | Much wetter than normal | Oct 16, 2026 |
| Walnut Gulch #1 USDA SCAN | 2" | 7% | Normal for this time of year | Oct 17, 2026 |
Moisture is the volumetric water content at the sensor. It is not comparable between soils, which is why the “vs. normal” comparison against each station’s own history is the reading to trust. No comparison yet means that station does not yet have enough of its own history for a confident comparison.
Cities in Arizona (60)
Open a city for its nearest station’s current soil moisture and temperature, planting windows, and lawn-care timing.
| City | ZIP |
|---|---|
| Apache Jct | 85217 |
| Apache Junction | 85117 |
| Arizona City | 85123 |
| Avondale | 85323 |
| Bapchule | 85121 |
| Buckeye | 85326 |
| Bullhead City | 86429 |
| Casa Grande | 85122 |
| Cave Creek | 85327 |
| Chandler | 85224 |
| Chandler Heights | 85127 |
| Coolidge | 85128 |
| Douglas | 85607 |
| Eloy | 85131 |
| Flagstaff | 86001 |
| Florence | 85132 |
| Fort Huachuca | 85613 |
| Fort Mohave | 86426 |
| Fountain Hills | 85268 |
| Gilbert | 85233 |
| Glendale | 85301 |
| Globe | 85501 |
| Goodyear | 85338 |
| Green Valley | 85614 |
| Hayden | 85135 |
| Kearny | 85137 |
| Kingman | 86401 |
| Lake Havasu City | 86403 |
| Marana | 85653 |
| Maricopa | 85138 |
| Mesa | 85201 |
| Mohave Valley | 86440 |
| Nogales | 85621 |
| Payson | 85541 |
| Peoria | 85345 |
| Phoenix | 85001 |
| Picacho | 85141 |
| Prescott | 86301 |
| Prescott Valley | 86312 |
| Quartzsite | 85346 |
| Queen Creek | 85142 |
| Red Rock | 85145 |
| Sacaton | 85147 |
| Safford | 85546 |
| San Tan Valley | 85140 |
| Scottsdale | 85250 |
| Sedona | 86336 |
| Show Low | 85901 |
| Sierra Vista | 85635 |
| Stanfield | 85172 |
| Sun City | 85351 |
| Sun City West | 85375 |
| Superior | 85173 |
| Surprise | 85374 |
| Tempe | 85280 |
| Tucson | 85701 |
| Valley Farms | 85191 |
| Wickenburg | 85358 |
| Willcox | 85643 |
| Yuma | 85364 |
Soil Moisture FAQ for Arizona
How wet is the soil in Arizona right now?
Across 5 monitoring stations in Arizona, 4 are wetter than normal, and 1 is about normal. Last updated October 17, 2026. Each station is compared against its own moisture history for the date, so the reading means the same thing everywhere.
Where does Arizona soil moisture data come from?
Every value is measured by an in-ground sensor, not estimated from a weather model. Readings come from the USDA SCAN network and NOAA USCRN stations, at or near the 2-inch root-zone depth (some stations report at the nearest available depth), and are refreshed daily.
What does wetter or drier than normal mean?
For each station, the current reading is compared against that station's own readings around this date across several years, after leaving out frozen-soil days. A raw moisture percentage is not comparable between two different soils, so the comparison against a station's own history is what makes the reading meaningful.
See the national soil moisture map, the full Arizona soil temperature directory (all depths), or the live national soil temperature map.