
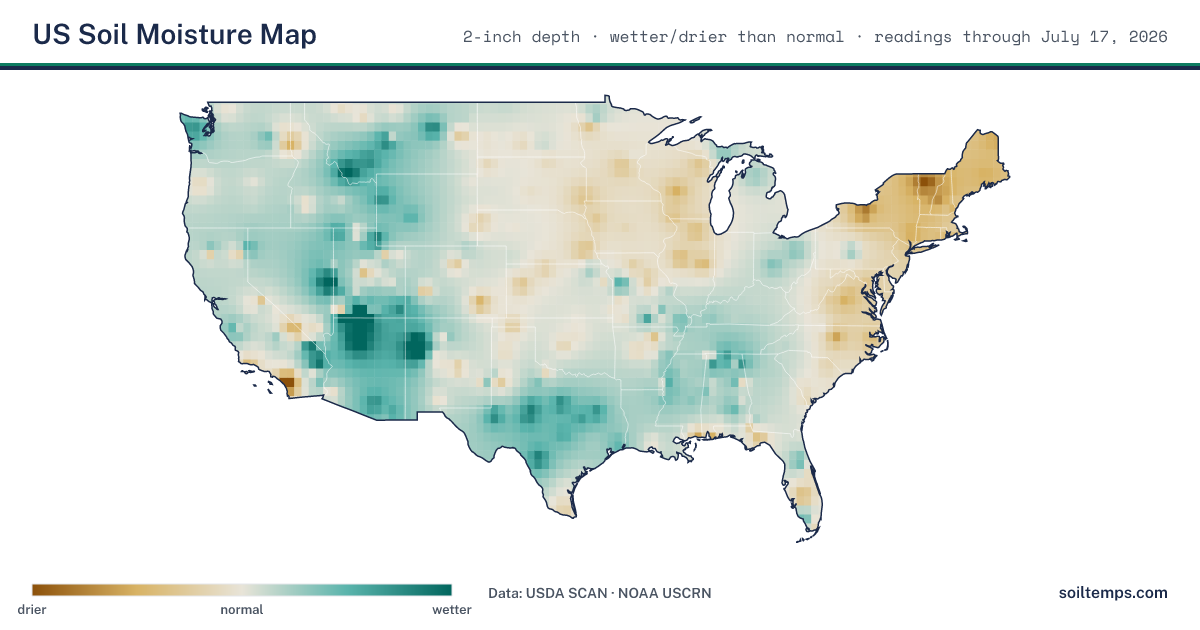
Soil Moisture Map
This soil moisture map, also called a ground moisture map, shows where the ground is wetter or drier than normal across the United States. Every value is measured by an in-ground sensor at the USDA SCAN and NOAA USCRN stations, then compared against that station’s own history for this time of year. That comparison is the point: a raw moisture percentage means little on its own, because 25 percent water in a sandy soil and a clay soil are not the same condition.
Today’s National Soil Moisture Map
Interpolated from the latest 2-inch readings at each station and refreshed daily. Brown is drier than normal, teal is wetter than normal, and the neutral band is about normal.
Understanding the Map
The map does not show a raw moisture number. It shows each station’s current reading as a position in that station’s own history for the date, so it reads the same way everywhere:
- Brown: drier than this station normally is for the date
- Neutral: about normal for the date
- Teal: wetter than this station normally is for the date
About the Data
Soil moisture readings come from the USDA SCAN network and NOAA USCRN stations across the continental United States, measured at the 2-inch root-zone depth and updated daily. The surface between stations is generated with inverse distance weighted (IDW) interpolation, so readings are most accurate near station locations. Each station is compared against at least two years of its own history, with frozen-soil days left out; stations without enough history are not shown.
Every station value on this map is measured by an in-ground sensor, not estimated from a weather model. The methodology page covers the sensor networks, depths, and update cadence. For your ZIP code, the soil temperature and moisture toolshows the nearest station’s current reading.